
Post date:
Friday, 8 July, 2016 - 14:36
Infographics - A Year in Support
Infographics are a visual representation of information, data or knowledge. These are produced by combining text, pictures and charts to tell your story.
At our most recent Network User Day we ran a session on infographics. We discussed how to make infographics, and the benefits of using these which includes;
- the ability to represent complex information quickly and clearly
- they are easy to share, which means that they are more likely to be shared than other content types
- they grab peoples attention
- People like facts and figures
- Mixing text with graphics increases understanding
Another great thing about infographics is that they can be published in varying places including annual reports, websites, newsletters and even social media.
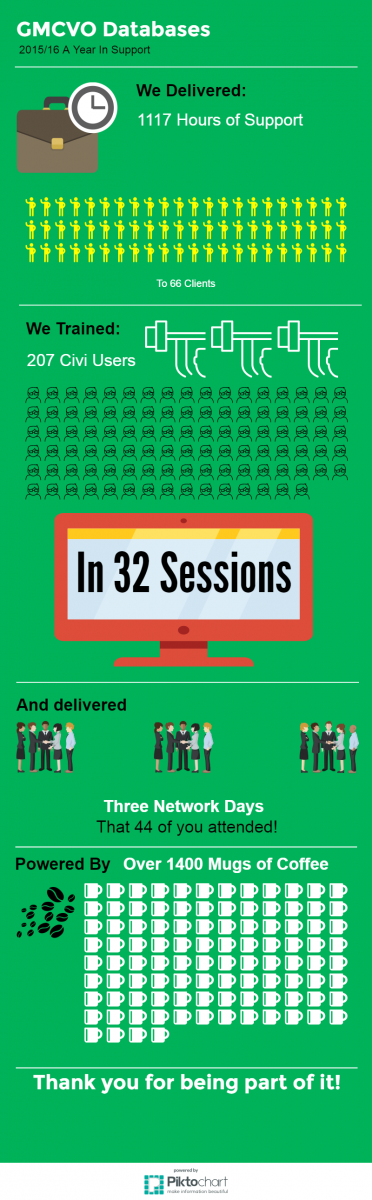
We used the data stored in CiviCRM to give an overview of the work we carried out in 2015/16, including the number of training sessions and individuals trained, amount of User Network Days and, most importantly, how many cups of coffee we drank.
There are many infographic tools available online. Craig produced our infographic using Piktochart (https://piktochart.com), which is free and easy to use.
Enjoy!